Redash
Redash is an open-source data visualization and analytics platform that helps organizations make sense of their data. It allows users to connect and query various data sources, build interactive dashboards, and share insights across their company.
Why Redash for the NHS?
Redash offers several benefits for NHS data analysis and visualization:
- Data integration: Redash supports multiple data sources, including SQL, NoSQL, Big Data, and APIs, allowing the NHS to query data from different systems to answer complex healthcare-related questions.
- Collaboration: As a cloud-based service, Redash facilitates collaboration among team members, enabling easy sharing of dashboards and insights.
- Customization: Being open-source, Redash can be customized to meet specific NHS requirements, ensuring no vendor lock-in.
- Cost-effective: As an open-source solution, Redash can help the NHS reduce costs associated with proprietary data analytics tools.
Getting Started with Redash
- Set up Redash: Choose between self-hosting or using a cloud-hosted solution. For self-hosting, you can use Docker for easy deployment . Alternatively, you can use Redash's cloud-hosted solution for a more managed experience.
- Connect your data sources to Redash: Redash supports a wide range of data sources, including SQL databases, NoSQL databases, and various APIs. You can connect to multiple data sources simultaneously, allowing you to query and visualize data from different systems in one place .
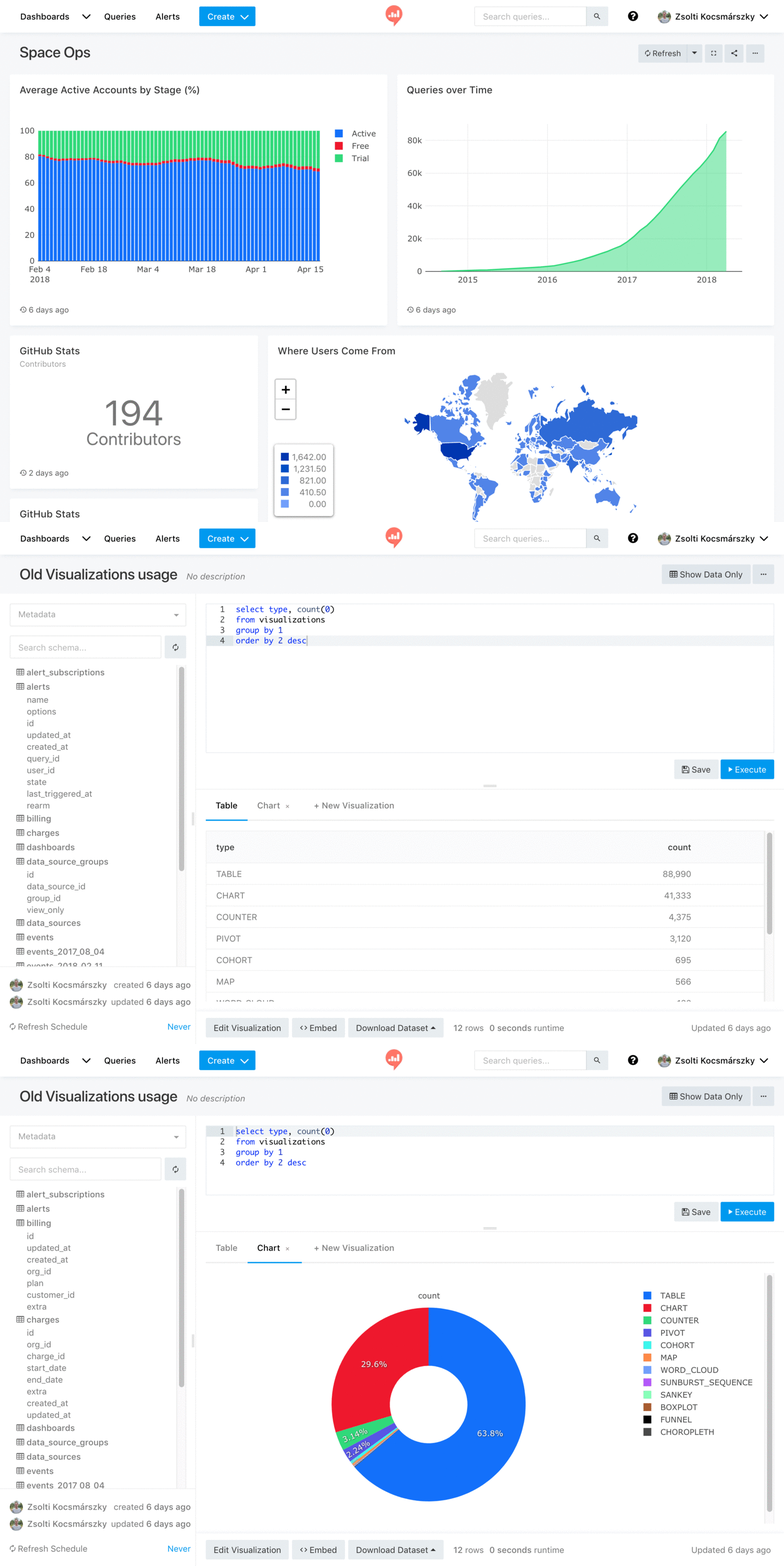
- Write queries using the powerful online SQL editor: Redash provides an intuitive SQL editor with features like auto-complete, syntax highlighting, and the ability to save and share queries. You can write SQL queries to extract and manipulate data from your connected sources .
- Create visualizations based on your query results: Once you have your query results, you can easily create various types of visualizations such as charts, graphs, and tables. Redash offers a range of visualization options to help you represent your data effectively .
- Build dashboards by combining multiple visualizations: Combine your created visualizations into comprehensive dashboards. These dashboards can provide an at-a-glance view of key metrics and insights, making it easier to monitor and analyze your data .
Examples of Redash in Action

Further Learning Resources
- Redash Documentation: Official documentation for Redash.
- Redash GitHub Repository: Source code and additional resources.